A professional analysis of any market from its real candles, with AI
DeepFA AI Market Analysis reads crypto, forex, gold, indices and shares by RTM rules: structure and direction, valued key zones, trading nodes and price patterns, and trade plans with entry, stop and targets — on an interactive chart, with a full report an AI model writes from those same findings.
AI Market Analysis — RTM Price-Action Analysis for Every Market
Most “AI analysis” tools ask a language model for its opinion on a symbol; the result is text whose prices come from nobody knows where. DeepFA AI Market Analysis works the other way round: it first reads the symbol’s real candles on five timeframes and computes every finding by fixed RTM price-action rules. The AI only writes the report at the end, from those findings, and may not write a number the computation did not produce.
The analysis starts with market structure. Three movement units in one direction make a leg, and a return of one unit makes a pivot of that timeframe; the movement unit is the weighted average range of that timeframe’s candles. Key zones are built from the pivots of the structure timeframe and the two above it, and each zone is valued by its timeframe, its touches, whether it was broken and retested, stop hunts, and whether a higher timeframe’s level sits behind it. Where two zones overlap, the higher timeframe wins.
Entries are found in trading nodes: the bases a move started from, the hidden levels of long candles and long shadows, the FTC of each pivot, and the accept zone after a breakout. Each node is classed FTR, ETR, CTR or OTR by its size against the movement unit of its own timeframe and the two above, and the class says whether the order goes at the start of the node, its middle, its last quarter or outside it. Patterns such as QM, spikes with the drives after them, divergent double tops and bottoms, and stop hunts are found too.
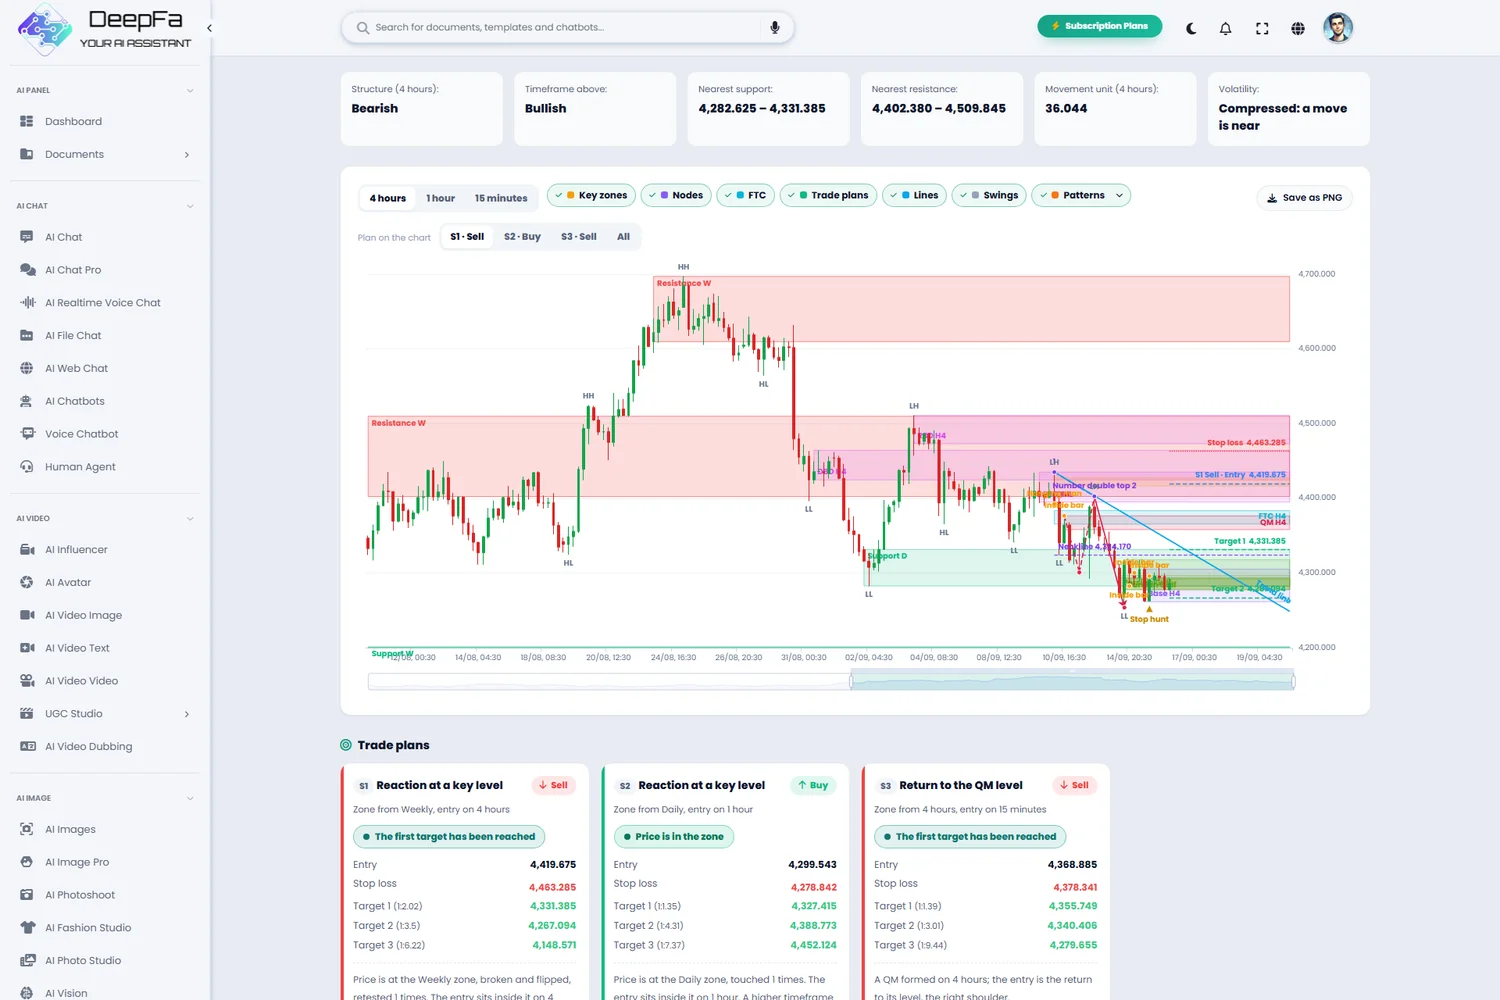
The result is a set of trade plans: an entry zone, a stop one movement unit of the trigger timeframe beyond it, and targets measured up the timeframe ladder and moved to the start of the nearest opposing zone, each with its risk to reward. All of it is drawn on an interactive chart of the structure, pattern and trigger timeframes, and the current view can be saved as a picture. Classic indicators are shown beside the analysis for reference only.
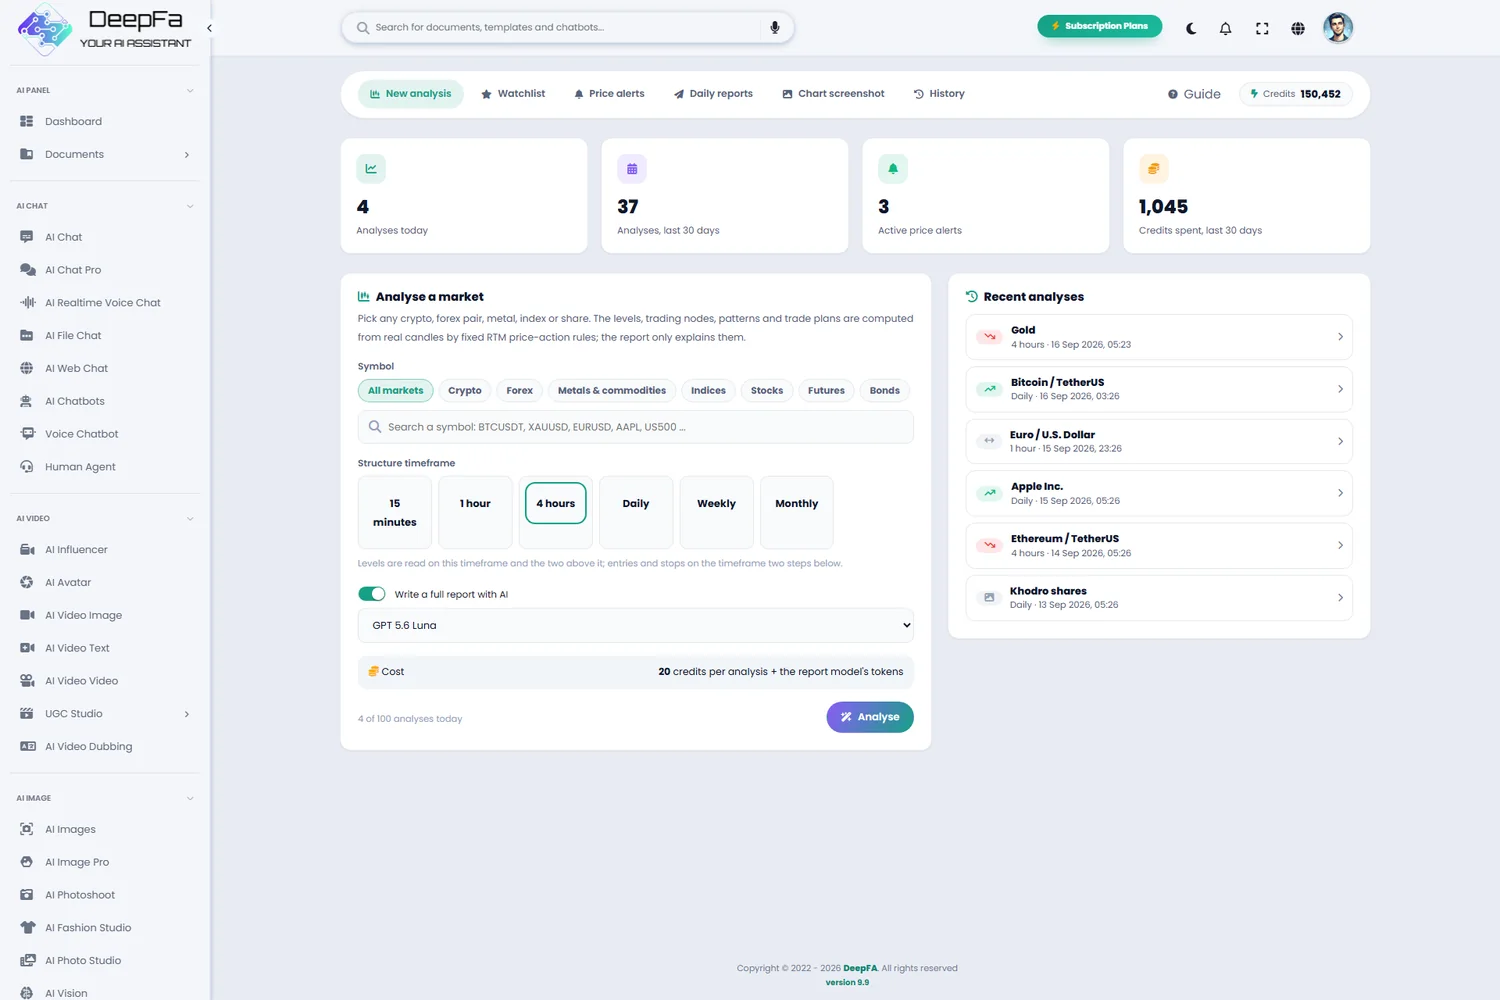
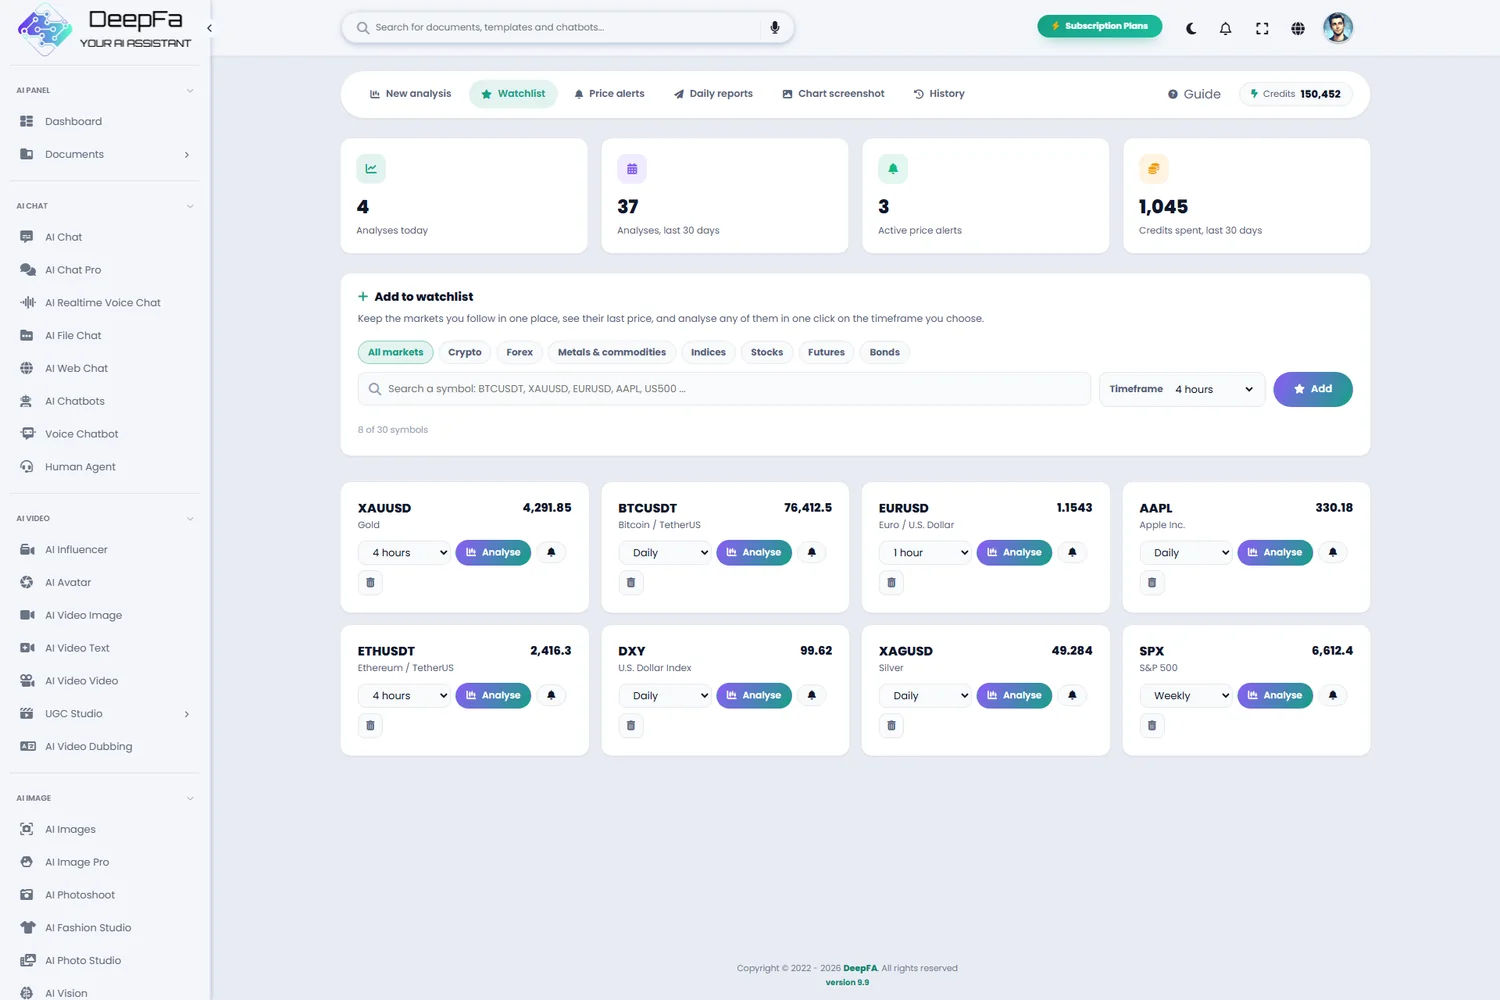
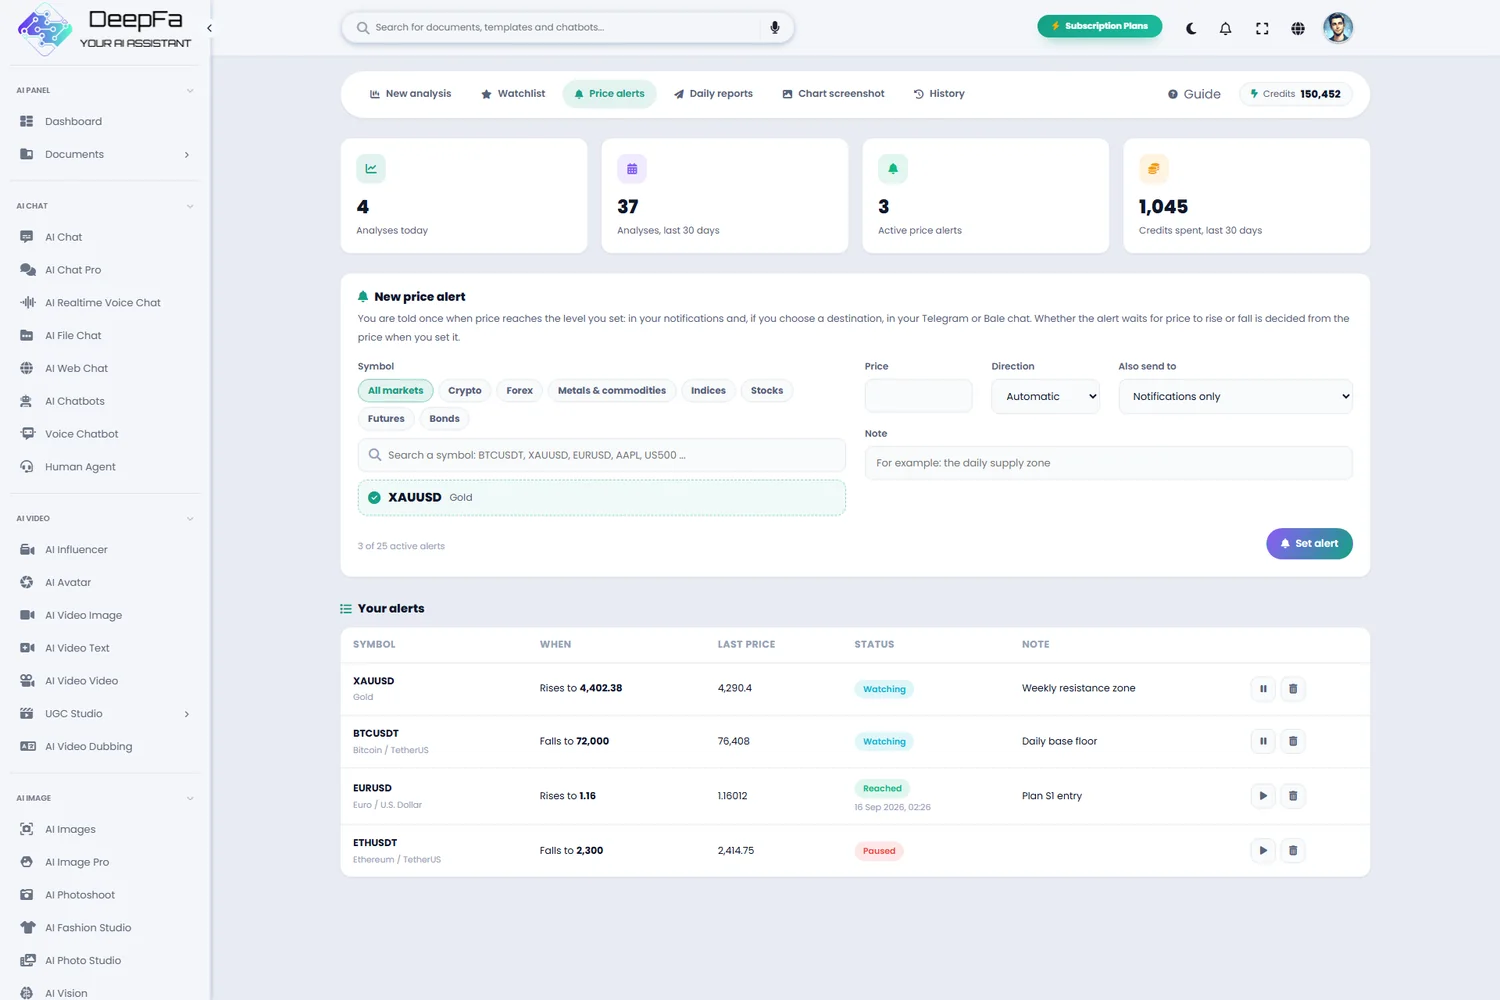
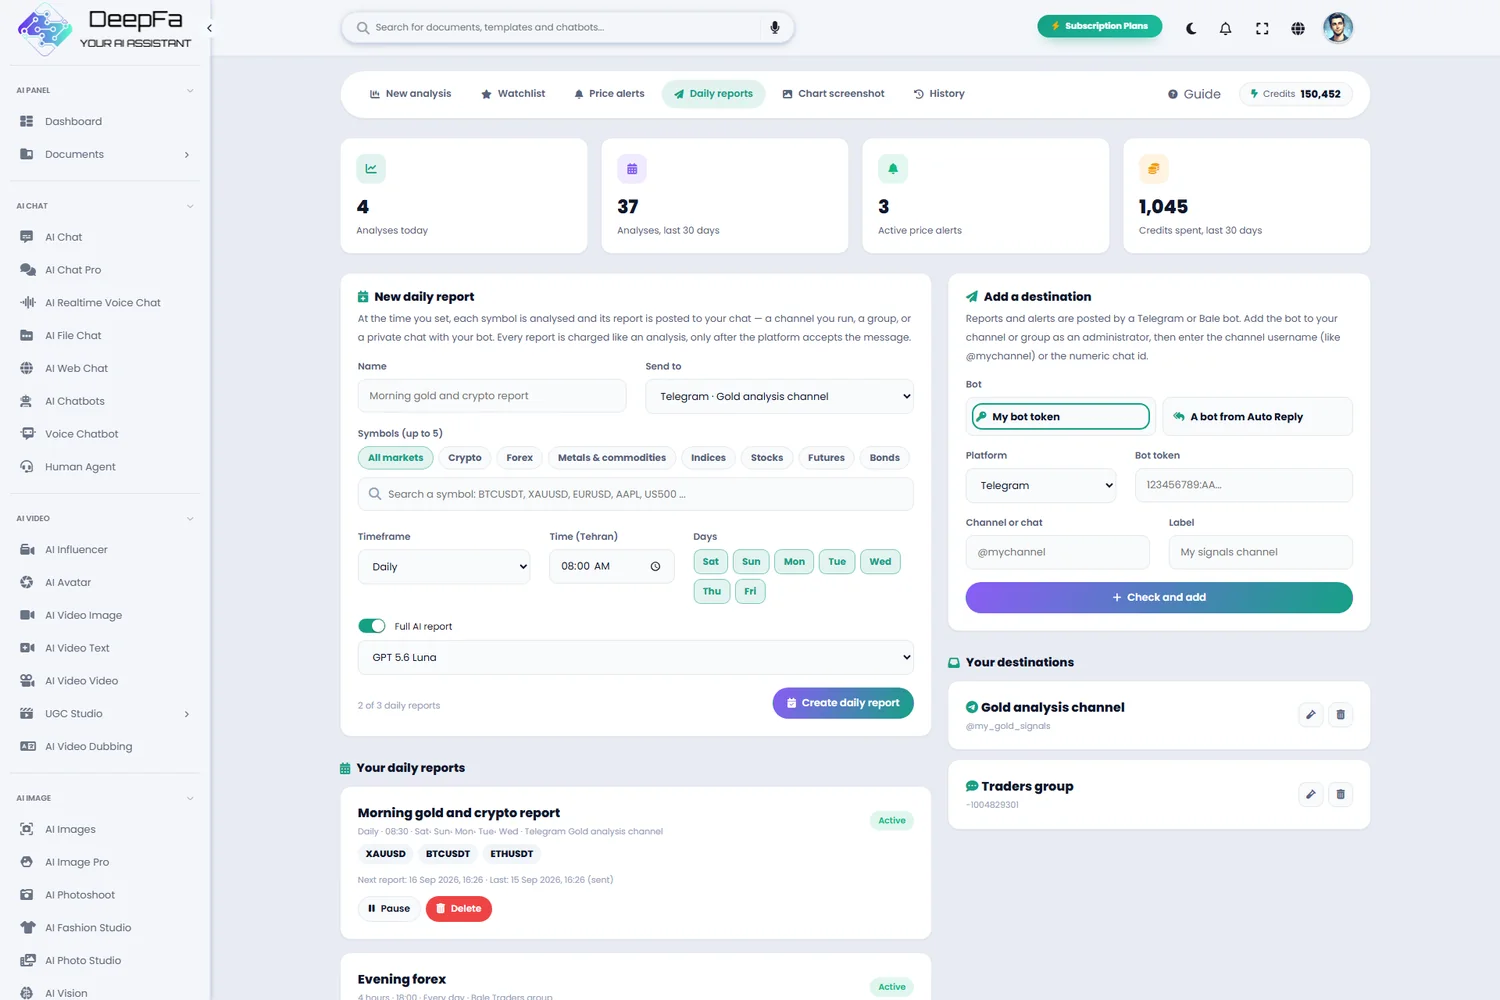
For the markets you follow, there is a watchlist with live prices, price alerts in your notifications, Telegram or Bale, and an automatic daily report to your channel or group. If a market is not in the symbol search, upload a picture of its chart and it is read by the same rules, with approximate prices. Every analysis is educational and none is investment advice.
Everything analysing and following a market needs
From the symbol search to a daily report in your channel — in one tool.
Every world market
Crypto, forex, gold and silver, oil, indices, shares and futures — with a symbol search and market filters.
Key zones, valued
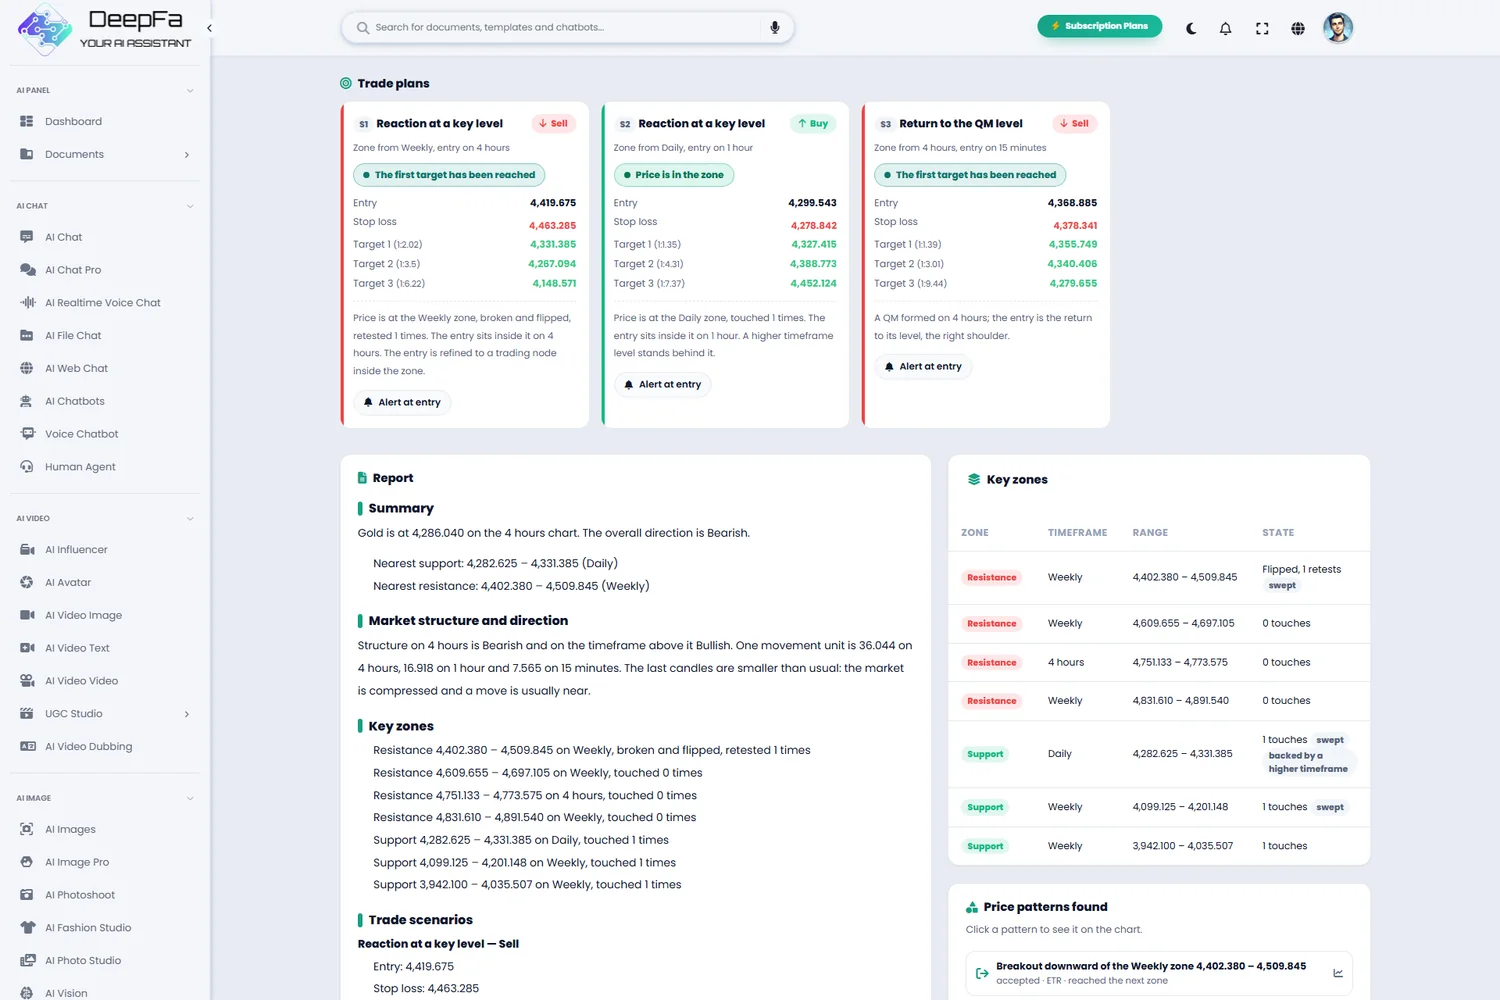
Levels from the pivots of the structure timeframe and the two above, with touches, breaks and retests, stop hunts and higher-timeframe backing.
Trading nodes
RBR, DBD, RBD and DBR bases, hidden levels of long candles and shadows, pivot FTCs and breakout accept zones, classed FTR to OTR.
Complete trade plans
An entry zone, a stop based on the trigger timeframe’s movement unit, and stepped targets with the risk to reward of each.
Interactive chart and PNG
Three timeframes with layers for zones, nodes, FTC, plans and swings — and the same view saved as a picture.
A full written report
The AI explains each zone and the trade scenarios from the computed findings alone.
Watchlist and price alerts
The symbols you follow with live prices, and alerts when price arrives, in notifications, Telegram or Bale.
Daily reports to your channel
Several symbols analysed at your time and days, posted automatically to your Telegram or Bale channel or group.
An analysis in 4 steps
Nothing to install and not a single line to draw by hand.
Pick a symbol
Search the symbol — Bitcoin, gold or euro dollar, for example — and choose the timeframe you trade on.
The rules analyse
Candles on five timeframes are read, and pivots, zones, nodes, patterns and plans are computed in seconds.
Read the chart and report
The zones and plans are drawn on the chart, and the report explains each one and what would cancel the scenarios.
Keep watching
Set an alert at the entry, add the symbol to your watchlist, or send a daily report to your channel.
Why DeepFA AI Market Analysis?
An analysis whose every number you can see on the chart.
Computed, not guessed
Every zone and plan comes from real candles by fixed rules; analysing the same symbol at the same moment twice gives the same result.
Several timeframes at once
Higher-timeframe levels, the chosen timeframe’s structure and the trigger timeframe’s precision sit together in one analysis.
The stop is always defined
No plan comes without a stop and a risk to reward, and no stop is wider than the trigger timeframe’s movement unit.
Every number can be checked
The AI writes only computed numbers; every price in the report is also on the chart and in the zones table.
Working while you are away
Price alerts are checked every minute and daily reports are posted to your channel on time.
Charged only once delivered
Credits are taken only when the analysis is shown or the daily report is accepted in your channel; alerts cost nothing.
From candles to a trade plan
All of this happens within a few seconds.
The candles are read
Candles of the structure, pattern and trigger timeframes and the two above are read, and each timeframe’s movement unit is computed.
Structure and zones are found
Pivots, legs and swings are marked, and key zones are valued by their touches, breaks and higher-timeframe backing.
Nodes and patterns are checked
Bases, hidden levels, pivot FTCs, breakout accept zones, spikes and drives, QM patterns and stop hunts are found.
Plans are built
Entries, stops and targets are built with the risk rules, ranked and drawn on the chart.
The report is written
The AI writes the full report from the findings, and the analysis is saved in your history.
Who is AI Market Analysis for?
Anyone who follows markets with price action.
Crypto traders
Key zones and trade plans for Bitcoin, Ether and altcoins on any timeframe
Gold and metals analysts
The structure of gold, silver and oil with daily, weekly and monthly levels
Forex traders
Majors and crosses with stops and targets based on the movement unit
Share and index investors
World shares and indices on the daily and weekly charts
Analysis channel admins
An automatic daily report on several symbols in a Telegram or Bale channel
Price-action teachers and students
Zones, nodes and patterns on real charts to practise with
A look inside AI Market Analysis
Real screens from the dashboard — click any image to enlarge.
Tools that work well alongside Market Analysis
Questions people ask about Market Analysis
Read the market by rules, not by guesswork
Sign up and see your first RTM analysis in seconds